
27 Aug
2025
27 Aug
'25
7:20 p.m.
I’ve finished an analysis of the CTPP 2017-21 data for Table B202105 (workers at workplace
by detailed means of transportation). This is for California counties, and California
census tracts, summarized to the county-level. The purpose is to ascertain the level of
missing data due to absence of secondary allocation (imputation) to the tract-level
database.
To reiterate, “primary allocation” of missing values for workplace location is always
produced (by the Census Bureau) to the county, place and MCD levels. “Secondary
allocation” was used in previous CTPP products, but was discontinued in the 2012-2016
CTPP. Secondary allocation imputes workplace location down to the TAZ or census tract or
block group levels. (There may be better ways of stating this. I’m using my human powered
AI to construct these statements.)
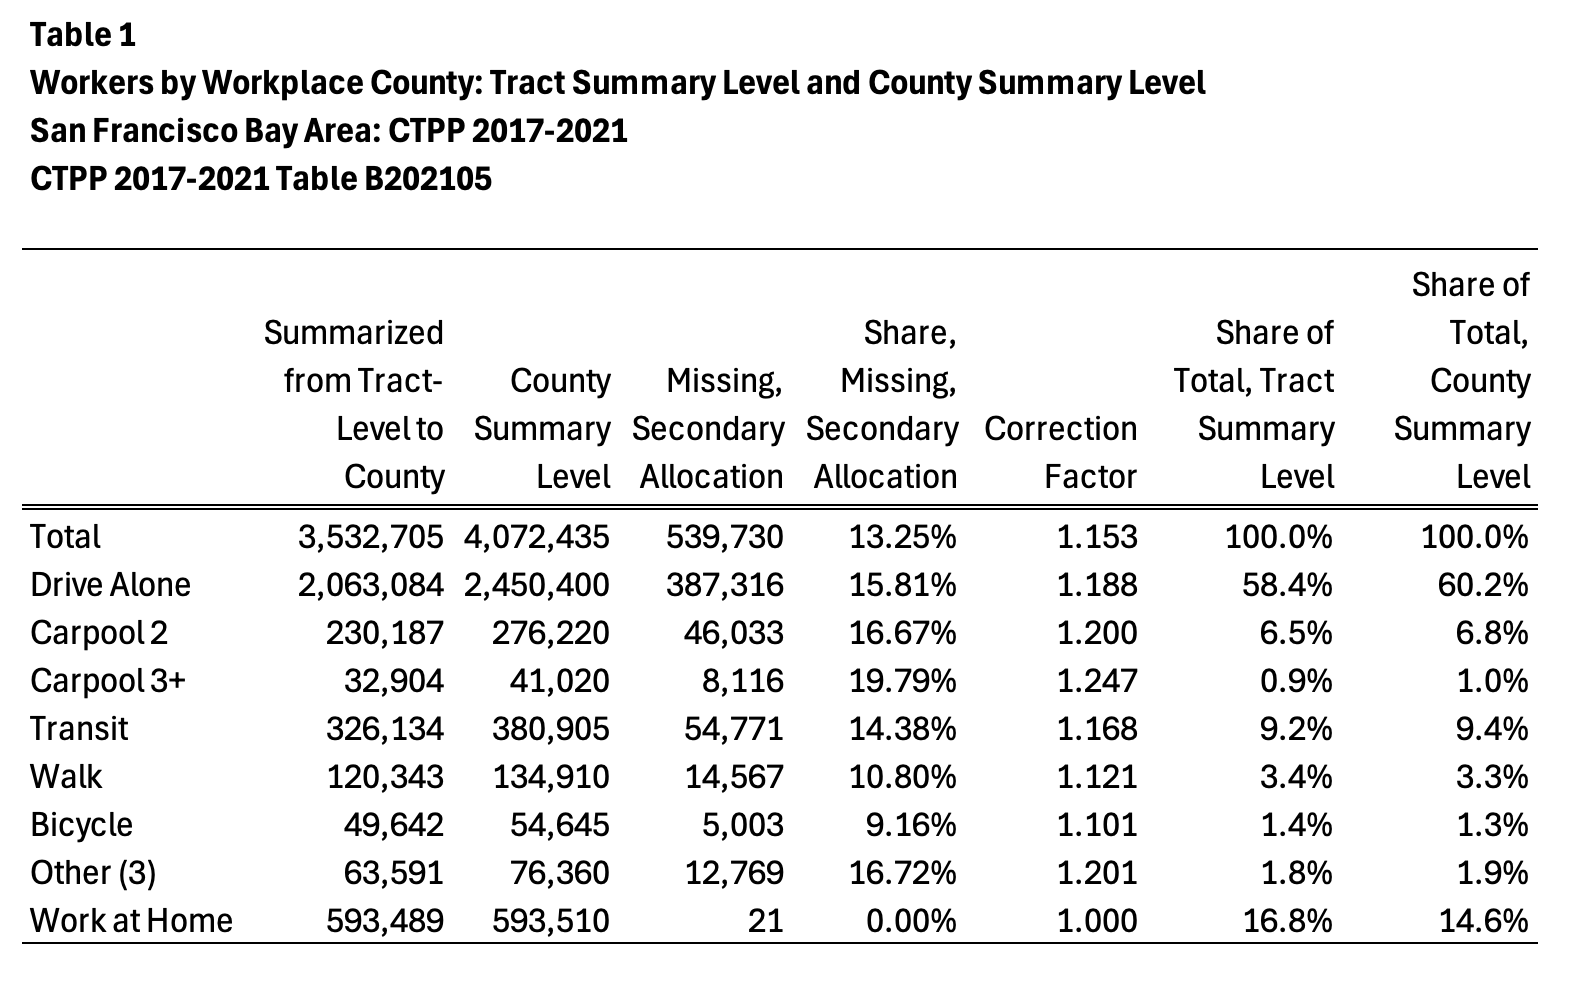
Results for the San Francisco Bay Area are included in this inserted graphic:

Overall, at least in the Bay Area, the least amount of missing secondary allocation are
for the bicycle-to-work and walk-to-work modes, at 9 to 11 percent missing values. The
most (worst) secondary allocation is for 3-or-more person carpools, 2-person carpools, and
other (3) (motorcycle + taxicab + other).
A possible explanation is that bicycle and walk commuters are more savvy and
address-conscious than carpoolers?
As should be expected, workers working at home should never have workplace allocation
issues, since the block-tract-place-county of workplace for at-home workers is identical
to their home location. Only non-home workers should be factored up in Part 2 tables.
The weirdness in the work-at-home totals (593,489 from tract data; 593,510 from county
summary level) is due to rounding issues at the tract vs county level. Moral of this
story: don’t expect tract-level data from the CTPP to aggregate neatly up to the county
level. It’s all due to rounding. But tract-level data from standard ACS five-year tables
*should* aggregate neatly up to county level.
I’m thinking that the most needed set of “county correction factors” will be for part 3:
factoring tract-to-tract commuters based on county-of-residence, county-of-work, and means
of transportation.
Here is my fully fleshed R script to analyze Table B202105 from both tract summary level
and county summary level file.
https://github.com/chuckpurvis/r_scripts/blob/main/ctpp1721_california_b202…
r_scripts/ctpp1721_california_b202105_1.R at main · chuckpurvis/r_scripts
github.com
I hope this is of use to the community!
Chuck Purvis
Hayward, CA
clpurvis(a)att.net <mailto:clpurvis@att.net>