
27 Aug
2025
27 Aug
'25
7:20 p.m.
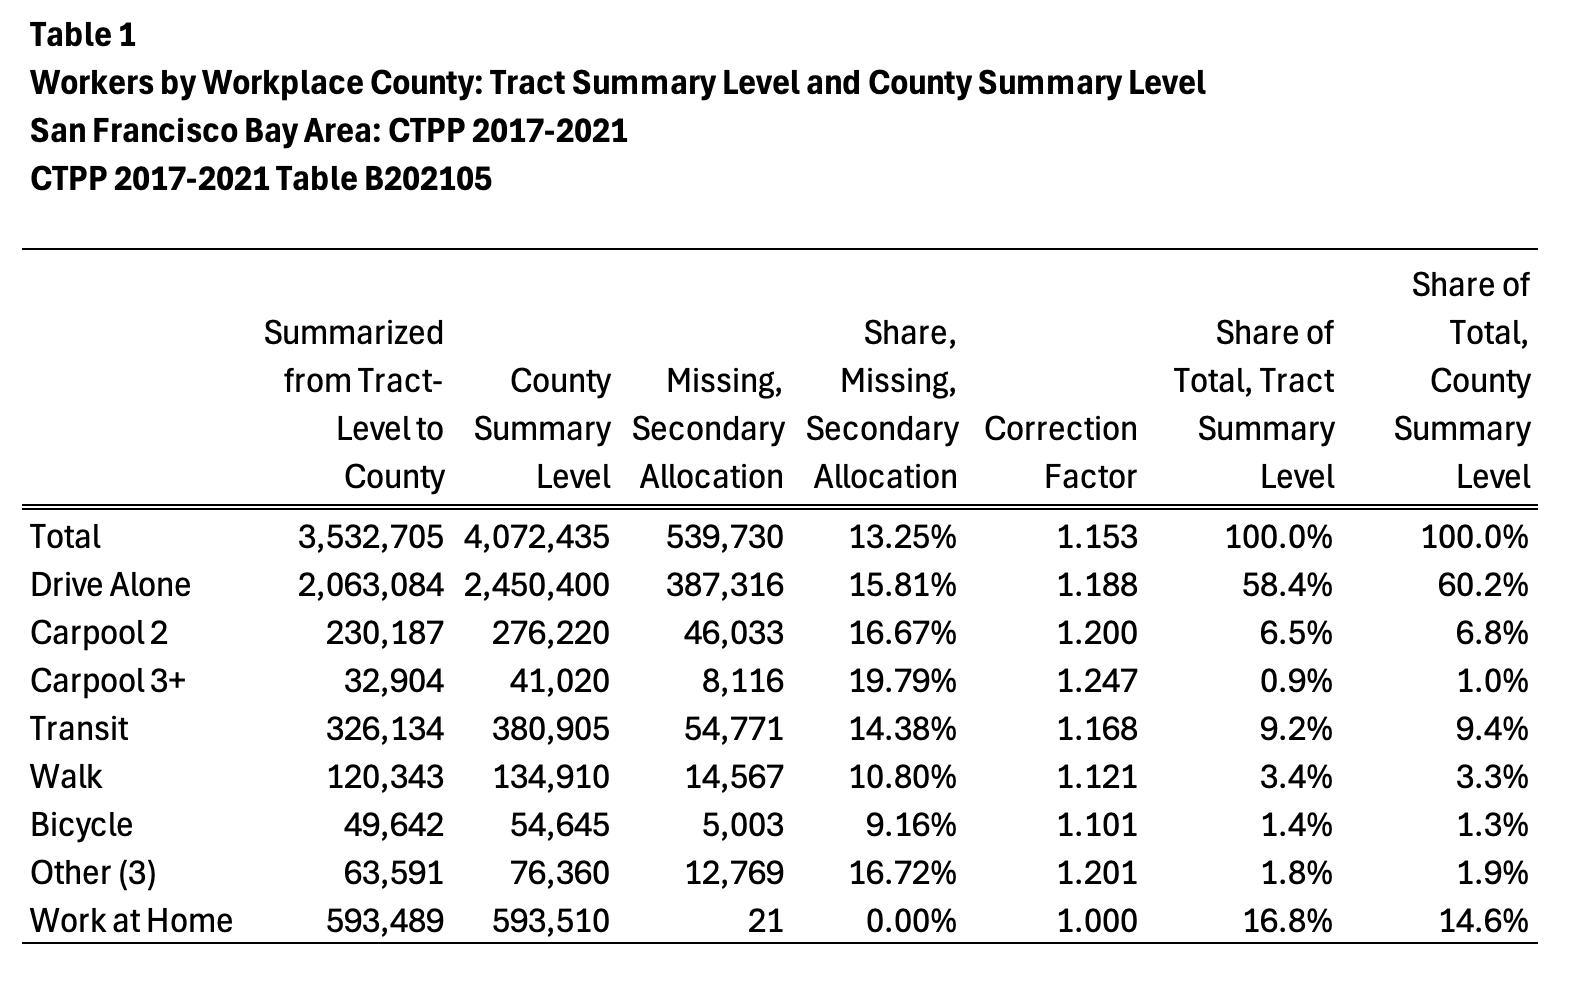
I’ve finished an analysis of the CTPP 2017-21 data for Table B202105 (workers at workplace
by detailed means of transportation). This is for California counties, and California
census tracts, summarized to the county-level. The purpose is to ascertain the level of
missing data due to absence of secondary allocation (imputation) to the tract-level
database.
To reiterate, “primary allocation” of missing values for workplace location is always
produced (by the Census Bureau) to the county, place and MCD levels. “Secondary
allocation” was used in previous CTPP products, but was discontinued in the 2012-2016
CTPP. Secondary allocation imputes workplace location down to the TAZ or census tract or
block group levels. (There may be better ways of stating this. I’m using my human powered
AI to construct these statements.)
Results for the San Francisco Bay Area are included in this inserted graphic:

Overall, at least in the Bay Area, the least amount of missing secondary allocation are
for the bicycle-to-work and walk-to-work modes, at 9 to 11 percent missing values. The
most (worst) secondary allocation is for 3-or-more person carpools, 2-person carpools, and
other (3) (motorcycle + taxicab + other).
A possible explanation is that bicycle and walk commuters are more savvy and
address-conscious than carpoolers?
As should be expected, workers working at home should never have workplace allocation
issues, since the block-tract-place-county of workplace for at-home workers is identical
to their home location. Only non-home workers should be factored up in Part 2 tables.
The weirdness in the work-at-home totals (593,489 from tract data; 593,510 from county
summary level) is due to rounding issues at the tract vs county level. Moral of this
story: don’t expect tract-level data from the CTPP to aggregate neatly up to the county
level. It’s all due to rounding. But tract-level data from standard ACS five-year tables
*should* aggregate neatly up to county level.
I’m thinking that the most needed set of “county correction factors” will be for part 3:
factoring tract-to-tract commuters based on county-of-residence, county-of-work, and means
of transportation.
Here is my fully fleshed R script to analyze Table B202105 from both tract summary level
and county summary level file.
https://github.com/chuckpurvis/r_scripts/blob/main/ctpp1721_california_b202…
r_scripts/ctpp1721_california_b202105_1.R at main · chuckpurvis/r_scripts
github.com
I hope this is of use to the community!
Chuck Purvis
Hayward, CA
clpurvis(a)att.net <mailto:clpurvis@att.net>

28 Aug
28 Aug
11:59 a.m.
Hi Chuck-coming at this from a different perspective I took a look at
the 11 Places in Illinois where Tracts nest within their place for Part
2 table B202100, Total Workers. Other than the loss of data what I found
interesting is that when I did the same analysis for the 2016-2020 data,
my town of Berwyn only had an 11% percent loss of trips. This is not
conclusive enough to say that the issue is getting worse but with the
stricter disclosure rules applied to the workplace data for the 2017
data this was not a surprise.
Place (No. Tracts) Place Totals Sum of Tracts Change
EST MOE EST MOE Nos. Percent
Berwyn (10) 12,705 1,133 11,135 -1,570 -12%
Burnham (1) 930 432 785 399 -145 -16%
Cicero (16) 18,010 1,228 14,775 -3,235 -18%
Elmwood Park (5) 3,460 548 3,115 -345 -10%
Evanston (19) 48,935 1,644 45,250 -3,685 -8%
Hometown (1) 435 176 345 137 -90 -21%
Lincolnwood (3) 7,105 649 6,470 -635 -9%
Oak Park (14) 22,745 1,149 20,360 -2,385 -10%
River Forest (2) 5,530 557 5,175 -355 -6%
Stickney (1) 2,795 580 2,665 577 -130 -5%
Venice (1) 320 95 295 91 -25 -8%
Totals 122,970 110,370 -12,600 -10%
I also took at look at B202105 which allowed for a slightly deeper dive
into the Tract loss issue. It is important at this point to note that
when working with Census-based CTPP tabular data, the total for
something is a completely separate published value. That means that it
is possible to sum all the components of a variable and compare that
total to the total. The figure below shows the results by summing all
the modal components for the Tracts in each Place and comparing it to
the sum of Tract totals for each Place. In other words, how does the sum
of the modes for each Tract sum, in Berwyn compare to the published sum
of the total workers in each Tract. Although these differences could be
attributed rounding, there are other disclosure methods at play that
obscure where this noise is getting introduced. This is evident when you
consider the the number Tracts in the places, identified in the
parenthesis.
Place (Nos. Tracts) Sum of the Tracts Difference
Totals Modes
Berwyn (10) 11,135 11,126 -9
Burnham (1) 785 784 -1
Cicero (16) 14,775 14,783 8
Elmwood Park (5) 3,115 3,114 -1
Evanston (19) 45,250 45,259 9
Hometown (1) 345 345 0
Lincolnwood (3) 6,470 6,453 -17
Oak Park (14) 20,360 20,385 25
River Forest (2) 5,175 5,153 -22
Stickney (1) 2,665 2,659 -6
Venice (1) 295 298 3
Totals 110,370 110,359 -11
Source: Table B202105 Means of Transportation to Work (17)
Sorry I do not have any R script to share. I used the online extraction
software and a lot of Excell ;-)
On 8/27/2025 6:20 PM, Charles Purvis wrote:
I’ve finished an analysis of the CTPP 2017-21 data for
Table B202105
(workers at workplace by detailed means of transportation). This is
for California counties, and California census tracts, summarized to
the county-level. The purpose is to ascertain the level of missing
data due to absence of secondary allocation (imputation) to the
tract-level database.
To reiterate, “primary allocation” of missing values for workplace
location is always produced (by the Census Bureau) to the county,
place and MCD levels. “Secondary allocation” was used in previous CTPP
products, but was discontinued in the 2012-2016 CTPP. Secondary
allocation imputes workplace location down to the TAZ or census tract
or block group levels. (There may be better ways of stating this. I’m
using my human powered AI to construct these statements.)
Results for the San Francisco Bay Area are included in this inserted
graphic:
Screenshot 2025-08-27 at 3.47.13 PM.png
Overall, at least in the Bay Area, the least amount of missing
secondary allocation are for the bicycle-to-work and walk-to-work
modes, at 9 to 11 percent missing values. The most (worst) secondary
allocation is for 3-or-more person carpools, 2-person carpools, and
other (3) (motorcycle + taxicab + other).
A possible explanation is that bicycle and walk commuters are more
savvy and address-conscious than carpoolers?
As should be expected, workers working at home should never have
workplace allocation issues, since the block-tract-place-county of
workplace for at-home workers is identical to their home location.
Only non-home workers should be factored up in Part 2 tables.
The weirdness in the work-at-home totals (593,489 from tract data;
593,510 from county summary level) is due to rounding issues at the
tract vs county level. Moral of this story: don’t expect tract-level
data from the CTPP to aggregate neatly up to the county level. It’s
all due to rounding. But tract-level data from standard ACS five-year
tables *should* aggregate neatly up to county level.
I’m thinking that the most needed set of “county correction factors”
will be for part 3: factoring tract-to-tract commuters based on
county-of-residence, county-of-work, and means of transportation.
Here is my fully fleshed R script to analyze Table B202105 from both
tract summary level and county summary level file.
r_scripts.png
r_scripts/ctpp1721_california_b202105_1.R at main ·
chuckpurvis/r_scripts
<https://github.com/chuckpurvis/r_scripts/blob/main/ctpp1721_california_b202105_1.R>
github.com
<https://github.com/chuckpurvis/r_scripts/blob/main/ctpp1721_california_b202105_1.R>
<https://github.com/chuckpurvis/r_scripts/blob/main/ctpp1721_california_b202105_1.R>
I hope this is of use to the community!
Chuck Purvis
Hayward, CA
clpurvis(a)att.net
_______________________________________________
CTPP mailing list --ctpp(a)listserv.transportation.org
To unsubscribe send an email toctpp-leave(a)listserv.transportation.org
--
Ed Christopher
708-269-5237
12
days inactive
13
days old
ctpp@listserv.transportation.org
1 comments
2 participants
participants (2)
-
 Charles Purvis
 -
 Ed Christopher